|
-
 Roxburgh, A.,
Ebersole, R., Helzer, T.
"Proposed Propane Marine Terminal in Portland " A
first white paper produced by Northwest Citizen Science
Initiative (NWCSI) in support of the campaign against the
proposal by Pembina Pipeline Corporation and the Port of
Portland to build a shipping terminal to export Canadian
propane. 3rd revised edition, March 15, 2015. Roxburgh, A.,
Ebersole, R., Helzer, T.
"Proposed Propane Marine Terminal in Portland " A
first white paper produced by Northwest Citizen Science
Initiative (NWCSI) in support of the campaign against the
proposal by Pembina Pipeline Corporation and the Port of
Portland to build a shipping terminal to export Canadian
propane. 3rd revised edition, March 15, 2015.
 ABSTRACT:
In
2014, Pembina Pipeline Corporation (PPC) inked an
agreement with the Port of Portland, Oregon, to build a
West Coast shipping terminal to export Canadian propane.
Why Portland? The simple answer: lower regulatory
hurdles; if Canadian propane bound for overseas markets
is transported by rail to US shipping terminals, it is
largely free of export restrictions and Federal permits
are not required. However, the project has already hit a
snag due to the existence of a protected natural
shoreline. The proposed terminal location is close to
and equidistant from Portland?s northern suburbs and
downtown Vancouver, Washington. ABSTRACT:
In
2014, Pembina Pipeline Corporation (PPC) inked an
agreement with the Port of Portland, Oregon, to build a
West Coast shipping terminal to export Canadian propane.
Why Portland? The simple answer: lower regulatory
hurdles; if Canadian propane bound for overseas markets
is transported by rail to US shipping terminals, it is
largely free of export restrictions and Federal permits
are not required. However, the project has already hit a
snag due to the existence of a protected natural
shoreline. The proposed terminal location is close to
and equidistant from Portland?s northern suburbs and
downtown Vancouver, Washington.
Nationally, the planning and
building of energy export terminals is happening at a
rate that far-outstrips the ability of city councils and
planning departments to keep up. Moreover, the PPC
project is far from green? and according to the city,
the terminal would increase Portland?s CO2 emissions by
about 0.7%. The PPC terminal also offers few direct
jobs, would close public waterways for days each month,
and unnecessarily endanger the lives of a significant
portion of the Portland and Vancouver populations.
In this paper we discuss ways
in which propane transportation and storage on such a
large scale is highly vulnerable and not inherently
safe. Particularly in view of the expected 25+ year
lifetime of the facility, we demonstrate that the PPC
propane export terminal project presents an unacceptable
risk, and high potential for serious impact on our
entire Portland/Vancouver urban area. It also far
exceeds any industrial factor originally envisioned for
Portland?s industrial zoning. We will comment on the
environmental impact statement and environmental impact
report (EIS/EIR) for a California LNG project that is
similar in many ways to the PPC proposal, but which was
canceled due to the improbability of mitigation of
various environmental issues: everything from high
density housing less than two miles away, to seismic
liquefaction risk, and the pressurized storage of up to
6-million gallons of liquid propane on site. This EIS/EIR
is representative of the level of planning detail that
we believe should be required before large, high-impact
projects get official go-ahead approval.
Simulation results obtained
using well validated EPA/NOAA models for various
accident and incident scenarios, whether manmade or due
to natural causes, or whether due to deliberate acts of
terrorism, are discussed. The results, which as
presented in the form of easy-to-understand maps,
demonstrate that Portland?s industrial zoning is
outdated, and that the thinking of our civic leaders who
would support the construction of a large scale propane
export terminal so close to where we Portlanders live
our lives, is obsolete, and due to its role in expanding
the use of fossil fuels, is at odds with Portland?s
widely promoted image as America?s Greenest City.
We believe that our propane
accident model results are of sufficient confidence to
support a conclusion that a propane export terminal less
than 10 miles beyond the Portland and Vancouver urban
boundaries is contraindicated, and must be rejected if
our cities are to live long and prosper.
We also briefly consider some
legal ramifications embedding a large propane export
facility inside a busy urban area.
-
Roxburgh, A.,
Ebersole, R., Helzer, T.
"Proposed Propane Marine Terminal (Part 2): Risk
Assessment" A second white paper produced by Northwest
Citizen Science Initiative (NWCSI) in support of the
campaign against the proposal by Pembina Pipeline
Corporation and the Port of Portland to build a shipping
terminal to export Canadian propane. April 10, 2015.
 ABSTRACT:
Pembina?s
proposed propane terminal would not be a simple addition
to Portland?s marine industrial scene. Its miniscule
number of jobs and relatively small tax payments would
not begin to compensate the loss of land values, loss of
railway and river capacity, and regional job loss.
Therefore it would not in itself represent any kind of
economic nirvana. ABSTRACT:
Pembina?s
proposed propane terminal would not be a simple addition
to Portland?s marine industrial scene. Its miniscule
number of jobs and relatively small tax payments would
not begin to compensate the loss of land values, loss of
railway and river capacity, and regional job loss.
Therefore it would not in itself represent any kind of
economic nirvana.
The terminal would, however,
forever change Portland?s character, and would represent
a radical move away from a focus on sustainable living
in a city that values ecological citizenship and
receives awards for its aspiration to be green.
Opening Portland?s door to
propane would replace Portland?s ecological aspirations
with a myopic focus on fossil fuels that in their spread
of unsustainability would lock down our rivers and our
transportation systems. It could spread tank farms
across all of T-6 and West Hayden Island, and in the
process destroy our recreational areas, and cover what
remains in a pall of concrete dust and diesel fumes.
They would likely be cut off in mid-stream, when
railways and governments finally realize that there is
no way to safely transport oil and gas in mass
quantities by rail, and it will no longer be done.
Better to realize now what we would lose, rather than
later-on when it would be too late.
This second part of the
previously published NWCSI White Paper, "Portland
Propane Terminal" looks more deeply into these issues
and topics introduced in part one of this on-going
research study and analysis.
-
Roxburgh,
A.J. (team leader), Aminzay S.Q., Khumalo, T., Nguyen, D.,
Binary Lookahead Carry Adder (BLCA). Project Final
Report (55:142 Introduction to VLSI Design,
Electronic and Computer Engineering Department, University
of Iowa), 1988 (pp. i-iii, 1-20).
OBJECTIVE:
Create
a floor plan and interconnections for cell design layouts (Magic).
Pad design: input protection, output buffering.
Types of BLCA: 4-bit, 8-bit, 16-bit, 32-bit.
Simulation: functional verification (Esim); timing
analysis (Crystal).
DESIGN:
Carry expression: Ci = Gi,
(Gi, Pi) = (gi,
pi)
o (Gi-1, Pi-1)
if 2 ≤ i ≤ n
= (gi, pi)
if i = 1,
where (g, p) o (g', p') = (g + (p.g'),
p.p')
Floor plan generation: Used corrected and verified C program
(appendix A).
Theoretical equations: time ~ log2(n),
n = adder size; area ~ n log2(n).
RESULT:
Completed simulation of 4-, 8-, 16-, and 32-bit BCLA.
Achieved reasonable propagation time (table 1, appendix D),
and showed that time delay closely followed log2(n).
Chip area is ~ 2n log2(n)+n (table 2).
-
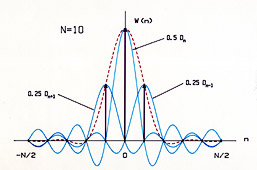
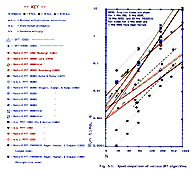
Roxburgh,
A.J.,
The simple Fourier transform, Thesis, M.Sc.,
University of Otago, 1987 (249 pp.).
(Errata relevant to the original bound
edition submitted to the University of Otago, Dunedin, New
Zealand is given at the end of the pdf file. Errata version
#1.1 Saturday April 30, 2022)
ABSTRACT:
A new algorithm for numerically evaluating the discrete
Fourier transform (DFT) is developed. The algorithm,
which yields results of high precision, is also
computationally efficient in the context of typical
8-bit microprocessor instruction sets. Because it gives
a particularly simple DFT implementation for such
microprocessors, the algorithm has been named the simple
Fourier transform, or SFT. Central to the SFT algorithm
is the implementation of multiplication using a lookup
table of squares. However, due to a mathematical
simplification the number of squarings required is
smaller than might be expected, each multiplication
essentially being reduced to a single ADD-and-SQUARE
macro-operation. Thus, even though most simple
microprocessors lack a built-in multiply instruction,
the slower alternative of software multiplication need
not be considered for DFT processing. The SFT algorithm
is extended with a Hann (sine-squared) data window
applied as a spectral convolution, which due to further
simplification of the arithmetic requires no additional
computation time. This modified form of the SFT has been
named the SFT-Hann algorithm. Good performance for
real-input narrow-band spectral analysis makes the SFT
and SFT-Hann algorithms useful for a variety of low-end
signal processing applications. Versions of these
algorithms written for the z80 microprocessor are
examined, and compared with several other discrete
Fourier transform programs. In order to verify the
methods used, as well as to make them more widely
accessible, several illustrative programs written in
BASIC are also presented.
-
Infrared Repeater System.
United States Patent Application Application
US 2010/0258729 A1
Published Oct 14, 2010. Filed April 13, 2009. Inventors:
Alastair Roxburgh, Richard Lenser, Bill Cawlfield
ABSTRACT:
An infrared sensor includes a photodiode receiving
an infrared signal. A first amplifier is connected to
the photodiode. A second amplifier is connected to the
first amplifier. A DC servo is connected in a feedback
loop between the output of the second amplifier and the
positive side of the first amplifier. An
analog-to-digital signal converter is connected to the
second amplifier. An output driver is connected to the
analog-to-digital signal converter. The infrared sensor
may receive and retransmit an infrared signal and may be
incorporated in an infrared repeater system."
SUMMARY:
A reduced number of capacitors in the
signal path lowers the "Q" and reduces phase distortion.
This allows IR signals to be repeated with less ringing,
overshoot, and distortion, all of which are important
for accurately passing the new high-density IR codes.
Examples of these codes are RC-MM and XMP, which
respectively use 4-ary and 8-ary symbol coding, rather
than the conventional binary (2-ary) format. The
corresponding code symbols are respectively 2 and 3 bits
long. Avoidance of intersymbol interference for these IR
codes requires timing precision to be maintained 4x
better than binary for RC-MM, and 8x better for XMP. It
is difficult to maintain a sufficient degree of ringing-
and overshoot-free accuracy in circuits that have a
modulation passband response that has too high a "Q"-value (i.e., a response that has too high an order, primarily
caused by too many coupling capacitor poles in the
frequency response). This new "Hi-Fi" IR repeater
architecture solves the problem.
-
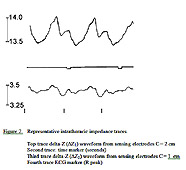
Baker, A.B., McLeod, C.N., Roxburgh, A.J., and Bannister, P.,
"Descending
aortic flow contribution to intrathoracic impedance-Development and preliminary
testing of a dual impedance model," Journal of Clinical Monitoring and
Computing, 22, pp. 11-22, 2008.
OBJECTIVE:
Impedance measurement of cardiac output has struggled to
become established partly because there have been only a
few attempts to establish a sound theoretical basis for
this measurement. Our objective is to demonstrate that
there is valuable aortic flow information available from
an intrathoracic impedance signal which may eventually
be useful in the measurement of cardiac output by
impedance technology.
METHODS:
A model, using dual impedance measurement
electrodes and the change in impedance when blood flows,
has been developed based on an intrathoracic impedance
model of the descending aorta and esophagus. Using this
model as the basis for measurement by an esophageal
probe, we provide solutions to the velocity of blood
flow in the descending aorta.
RESULTS:
Five patients were studied. Only three patients
had suitable signals for analysis but the aortic flow
profiles from these three patients were consistent and
realistic.
CONCLUSION:
Aortic blood flow information may be
obtained from the intrathoracic impedance signal using
this dual impedance method.
-
Baker, A.B. and Roxburgh, A.J.,
"Computerised EEG
monitoring for carotid endarterectomy," Anaesthesia and Intensive Care,
14(1), pp. 32-36, Feb., 1986.
ABSTRACT:
A prospective study was undertaken in twenty patients
undergoing carotid endarterectomy using computerised EEG monitoring in the form of a
density-modulated spectral array, spectral edge
frequency and integrated EEG power for monitoring
cerebral ischaemia. This form of monitoring proved to be
easy to use and understand. Because ischaemic EEG events
longer than one minute were not necessarily followed by
postoperative deficits, the definition of significant
events that would cause ischaemia may need to be
modified.
-
Roxburgh, A.J., Baker, A.B., Bannister, P., and McLeod, C.,
"Aortic blood flow from intra-thoracic impedance," Proc. Univ. Otago Med. Sch.,
63, pp. 73-74, 1985.
ABSTRACT:
Intra-thoracic electrical impedance change may be caused
as much by aortic blood flow as by aortic movement,
contradicting a statement by Mitchell and Newbower (1979) that all of the impedance change is due
to movement alone. With two impedance analyzers,
however, the aortic movement component of the
intra-thoracic impedance may be cancelled out enabling a
more accurate measurement of the aortic blood flow. Dual
impedance data was analyzed for one cardiac cycle from a
patient following cardiac surgery, which using a
simplified anatomical model, gave a stroke volume of 57
ml. Cardiac output measured simultaneously by thermal
dilution gave a stroke volume of 59 ml.
-
Baker, A.B., Roxburgh, A.J., and McLeod, C.,
"Intra-thoracic impedance plethysmography and aortic blood
flow," Proc. Univ.
Otago Med. Sch., 62, pp. 69-70, 1984.
ABSTRACT:
Mitchell and Newbower (1979) produced a
theoretical model which shows that any change in the
intra-thoracic electrical impedance is unlikely to be
correlated with stroke volume, due to the inability to
distinguish aortic movement from blood flow. Their model
did not take into account the increase in the electrical
conductivity of blood that occurs when blood flows,
which can be as high as 25%, as reported by Coulter
(1949), and Visser (1981) and others. This study has
refined these models to generate an equation that
defines the relationship between blood velocity and
other components of the intra-thoracic impedance. From
blood velocity , stroke volume may be derived.
-
Baker, A.B. and Roxburgh, A.J.,
"Intra-thoracic impedance plethysmography and cardiac output,"
Proc. Univ. Otago Med. Sch., 62,
pp. 12-14, 1984.
ABSTRACT:
Oesophageal catheter probes provide an established
method of measuring variables such as ECG, temperature,
heart and breath sounds, diaphramatic EMG, and
electrical impedance. One advantage for the
trans-thoracic electrical impedance measured by the
oesophageal probe is that it gives a pulsatile component
of 5-10% compared with 0.2% for the trans-thoracic
method. The aim of this study was to document the better
cardiac-related signal-to-noise ratio from the
intra-thoracic method, as a first step in allowing
better impedance-based measurements of cardiac output.
-
Roxburgh, A.J. and Baker, A.B.,
"The use of disposable ECG
electrodes for intraoperative electroencephalography,"
Proc. Univ. Otago Med.
Sch., 61, pp. 51-53, 1983.
ABSTRACT:
Following on from the suggestion to use disposable
electrocardiograph (ECG) electrodes for intraoperative
electroencephalography (EEG), as a time-saving and
reliability measure, and a recent theoretical prediction
that two widely-spaced EEG electrodes attached to the
frontal and mastoid regions of the scalp will be
sufficiently sensitive to detect diffuse events, as well
as major focal events such as ischaemia, we decided to
compare the suitability of various electrodes for EEG by
measuring the electrical impedance of such a
widely-space pair of electrodes. Low impedance is an
important factor in EEG measurements, but is not
typically specified for ECG electrodes. Standard gold
cup electrodes were compared with two varieties of
disposable Ag/AgCl ECG electrodes, and
stainless steel 27 gauge needles. In terms of electrical
impedance at EEG frequencies, one brand of disposable
ECG electrodes performed as well as the traditional gold
cup EEG electrodes.
-
Roxburgh, A.J.,
"Spectral edge frequency: a comparison of methods,"
Proc. Univ. Otago Med. Sch., 61, pp. 49-51, 1983.
ABSTRACT:
Owing to its value in the detection of cerebral
ischaemia, spectral edge frequency (SEF) stands
out as the single most useful univariate descriptor of
the electroencephalogram (EEG) power spectrum. Previous
work used the cumulative power method to define a
significant upper spectral edge, however this correlates
poorly with visual estimates. Rampil et al (1980)
improved the detection of the spectral edge by using a
recursively-filtered, template-matching algorithm, but
found that is did not provide reliable detection for the
human EEG.
-
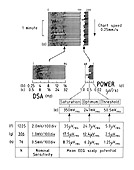
Roxburgh, A.J. and Baker, A.B.,
"A standard for display of EEG data using the density
modulated spectral array,"
Proc. Univ. Otago Med.
Sch., 60, pp. 81-83, 1982.
ABSTRACT:
The density-modulated spectral array (DSA) is one of the
more recently developed techniques for automated
processing and display of clinical EEG data. Compared
with earlier display methods. the DSA offers improved
legibility of spectral patterns, yet is more easily
integrated into existing patient monitoring systems.
This report presents a concise description of the DSA
system currently in use at Dunedin Hospital.
-
Roxburgh, A.J., Dobbinson, T.L., and Baker, A.B.,
"Monitoring ischaemic EEG events with the DSA display,"
Proc. Univ. Otago
Med. Sch., 60, pp. 46-47, 1982.
ABSTRACT:
The density-modulated spectral array (DSA) is a
relatively new techniques for displaying the EEG power
spectrum in a compact pictorial form which seems useful
for detecting cerebral ischaemic and hypoxic events.
This report describes preliminary trials using the DSA
at Dunedin Hospital.
-
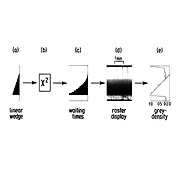
Roxburgh, A.J. and Baker, A.B.,
"Linear grey-scale raster displays on a thermal strip-chart
recorder,"
Proc. Univ. Otago Med. Sch.,
60, pp. 16-18, 1982.
ABSTRACT:
The term "raster" derives from the scanning pattern used
in television. Density-modulated raster displays plotted
on a thermal strip-chart recorder have for several years
been used to display EEG spectral data (the
density-modulated spectral array, or DSA). The DSA shows
frequency and power (pen position and grey-density,
respectively) versus time. The
raster grey-density is varied by changing the pen
scanning speed, thereby varying the amount of heat
applied to the chart paper. An inherent non-linearity in
the grey scale is compensated for with a simple
correction that is derived in the paper, and is found to
obey a square-law. Retrace speed limitations limit the
available contrast ratio to about 5:1, which causes some
loss of data at small values of the density variable,
however the parabolic density map can be offset to
compensate.
-
Holmes, C.McK. and Roxburgh, A.J.,
"A computer simulation of gas concentrations in the circle
system,"
Proc. Computing in Anesthesia
Symposium, Santa Monica, CA, 1982.
ABSTRACT:
The complex interaction of factors governing the
concentration of gases in an anesthetic circle system
are not easily understood by medical students, interns
and residents. Even when the inhalational components of
an anesthetic are nitrous oxide and oxygen only, it is
not a simple two-component model, due to the presence
initially of air in the lungs and circuit. The
interacting factors are many, however, in the clinical
situation some of these factors cannot be varied, and
others can be altered only within safety limits. To this
end a computer simulation has been devised, in which all
of the variables may be changed at will, and the effects
observed by the student. The program, which uses the
nitrous oxide uptake rate found by Severinghaus, is
written in Applesoft BASIC. The user can initially set
the flows of the nitrous oxide and oxygen, the oxygen
consumption, and stop time. Further, the initial values
of circuit volume and nitrous oxide uptake may each be
halved or doubled. At the stop time the use may exit the
program or continue with the same or altered variables.
The results are displayed in numerical and graphical
form.
-
Roxburgh, A.J. and Holmes, C.McK.,
"A computerized anesthesia record for the smaller hospital," Proc. Computing in Anesthesia
Symposium, Santa Monica, CA, 1982.
ABSTRACT:
Placeholder
(under construction).
-
Smith, N.T., Roxburgh, A.J., and Quinn, M.L.,
"Continual measurement of airway resistance; use of a
microprocessor controlled ventilator," Anesthesiology,
53:s389, 1980.
ABSTRACT:
A microcomputer-controlled ventilator which can generate
virtually any type of waveform has been developed. To
allow the continual measurement of airway
resistance during ventilation, it was programmed it to
superimpose high frequency square waves upon the regular
flow pattern: a square wave, half sine wave, ramp,
or reverse ramp. We determined that the maximum
difference in the high frequency amplitude, between high
and low resistance, was seen with a high frequency of 5
Hz. Normal changes in compliance did not change the high
frequency amplitude.
-
Edwards, P.J., Hurst, R.B., Roxburgh, A.J., and Stanley,
G.R., Data acquisition and processing. Otago Wind Energy Resource Survey
Phase II. Report No. 2, New Zealand Research and Development Committee.
April 1979. NZERDC P13, ISSN 0110-5388.
ABSTRACT:
This report describes methods of data acquisition,
processing and analysis used in implementing the NZ Wind
Energy Resource Survey in Otago. Field operation of
wind-run and wind-speed anemometers, electronic wind
speed integrators and wind speed recorders is described.
The recovery of field recorded data in computer
compatible form and its subsequent analysis to provide
wind energy parameters is also described. Examples of
these analyses are given. Computer program listings are
given in the internal version of this report, available
from the Department of Physics, University of Otago,
Dunedin, New Zealand.
-
Roxburgh, A.J., Edwards, P.J., and Hurst, R.B.,
"Acquisition and analysis of Otago wind energy data," Proc. N.Z.
Meteorological Service Symposium on Meteorology and Energy, Wellington, New
Zealand, Oct 11-12, 1977. Proc. New Zealand Meteorological Service, May 25,
1978.
ABSTRACT:
This paper describes the acquisition and analysis of
wind data by the University of Otago as part of the Wind
Energy Resource Survey of New Zealand. Field operation
of both wind-run and wind-speed anemometers by the Otago
University Physics Department is detailed, together with
calibration data. A wind speed recording system is
described with particular reference to the continuous
data format used. The format allows flexible readout in
computer compatible form, in analog and numeric printer
chart form, or allows direct analysis of the recovered
analog wind-speed variable using special hardware.
-
Hurst, R.B., Edwards, P.J., and Roxburgh, A.J.,
"Characterisation of wind energy sites," Proc. N.Z. Meteorological Service
Symposium on Meteorology and Energy, Wellington, New Zealand, Oct 11-12, 1977.
Proc. New Zealand Meteorological Service, May 25, 1978.
p.57-68.
ABSTRACT:
The Otago University Physics Department, as part of its
involvement in a national survey of wind energy
resources, has logged a large quantity (approximately 10
logger-years) of wind speed data on magnetic tape from a
selection of Otago sites. The blocks of data are
continuous and up to a time 30 days in length. The
recording format allows digitization with time
resolutions of 2 s chosen when the tape is read out.
Times of 64 seconds and 112 seconds have often been
used, to give convenient speed resolutions of 0.1 or 0.2
m/s (depending on the variety of logger). However, time
resolution down to a few seconds is attainable. Access
to computing facilities is available directly (PDP11) or
via punched paper tape. This paper describes some of the
analysis carried out to date on this data to extract
statistical information relevant to wind power
generation.
-
Edwards, P.J., Hurst, R.B., and Roxburgh, A.J.,
"Aerogenerator performance at representative Otago sites," Proc. N.Z.
Meteorological Service Symposium on Meteorology and Energy, Wellington, New
Zealand, Oct 11-12, 1977. Proc. New Zealand Meteorological Service, May 25,
1978. p.85-92.
ABSTRACT:
Electricity supply authorities in New Zealand have more
difficulty in meeting load demands in late winter and
early spring than at other times in the year. Thus, aerogeneration on a large scale will be of most
value if it can provide a reliable source during this
period. Of course, it is unrealistic to expect to be
able to provide a full-time base load from the area
covered by the Otago survey, measuring approximately 150
km by 100 km, but when similar studies become available
from other parts of New Zealand then the ability of wind
energy to provide winter base load can be assessed. Six
special aspects of winter winds in Otago are examined in
this report.
-
Edwards, P.J. and Roxburgh, A.J.,
"A low cost meteorological data logging system for remote
sites," Proc. World
Meteorological Organization TECIMO Conf., Hamburg, July 1977. University of Otago Physics
Department publication Astrophys 77/4
SUMMARY:
This
paper describes the design of a low cost, low power magnetic
tape cassette data recorder, its use at remote sites, and
the associated data readout facilities. A conventional
magnetic cassette transport system with low power slow speed
DC motor is used. In the single data mode, clock pulses
derived from a crystal controlled oscillator are recorded on
one track, and event pulses on the second track. A four
channel head may be used to provide three data
channels with a time resolution of one second, channel
bandwidth 3 Hz, for one month recording period on a standard
C-90 cassette. Power drain is 60 mW. The recorder has been
successfully used with solarimeters, anemometers, and
tipping buck rain gauges. Longer record duration is obtained
with proportionally reduced time resolution and frequency
response. The read-out facilities include analog chart
recording, paper tape punching, and character printing as
well as direct access to a minicomputer.
-
Hurst R.B., Roxburgh A.J., and Edwards P.J.,
Computer
program for atmospheric turbidity determination, University of Otago Physics
Department publication Astrophys 77/5, (Document produced as
part-fulfillment of N.Z. Meteorological Service Turbidity Contract), 1977.
ABSTRACT:
It
has been proposed (Edwards, P.J. and Othman, M.,
Southern Stars, Journal of the Royal Astronomical
Society of New Zealand, 26:8, p.184, 1976)
that measurements be made of atmospheric stellar
extinction at selected astronomical observatories, for
the purpose of estimating atmospheric turbidity. This
report describes data reduction and a Burroughs 6700
computer programme developed to process the data from
these astronomical observations.
The astronomical observations consist of photoelectric
measurements at several wavelengths of light from a
known star (i.e., with known right ascension and
declination, and known spectral characteristics). These
measurements, made for a range of zenith angles (and
hence for a range of air-path lengths) allow
determination of the atmospheric extinction, at the
wavelength in question. The principal processes
contributing to this extinction are Rayleigh scattering,
ozone absorption, and aerosol scattering. The extinction
due to Rayleigh scattering and ozone absorption alone
may be estimated for a model atmosphere. Such an
estimate is generally less than the extinction actually
measured, the difference being attributed to turbidity.
-
Cherry
N.J., Edwards P.J., and Roxburgh A.J., "Low-cost
instrumentation for a wind energy survey," Proc. 22nd
International Instrumentation Symposium, San Diego, May
25-27, 1976.
ABSTRACT:
An
observational programme for a wind energy survey is
being carried out in several areas of New Zealand. The
instrumentation required, excluding the anemometer
assembly, was developed locally. Wind-run, or mean wind
speed, is obtained by counting one pulse per revolution
of the anemometer on a modified pocket calculator. Power
requirements are reduced to less than an average of 5 mA
by turning the display off when it is not being read.
This is a low cost system with the additional advantage
of being able to run hundreds of meters of cable to the
display in a location remote from the mast.
Mean wind speeds over averaging periods of an hour or
submultiples of an hour down to a minute or less are
recorded electronically on standard reel-to-reel or
cassette tape decks or recorders. Two systems are in
use. The first records a frequency proportional to the
wind speed on channel one and a clock pulse train on
channel two. Mean wind speeds over time intervals as
short as three to five seconds or as long as one month
can be retrieved. The second system uses a standard
cassette tape recorder to record data in an incremental
digital form, using 12-bit binary numbers recorded in
biphase audio tones. Averaging periods of 1, 2, 5, 15,
30, or 60 minutes may be selected. The density of data
on the tape is increased by recording the data in blocks
of 100 numbers out of a memory unit. All systems can be
powered from the mains or from 12 V dc batteries.
-
Roxburgh, A.J.,
The construction of apparatus producing
kilowatt nanosecond pulses at 337.1 nm for the study of organic laser dye
characteristics. Thesis, Post Grad. Dip. Sci., University of Otago, 1972 (54
pp.). (Short title: N2 Laser at 337.1 nm for the Study of Organic Laser Dyes.)
ABSTRACT:
This work concerns the modification of a superradiant
nitrogen laser built by Manson (1972). Project stages:
1) Redesign the laser discharge channel using
demountable glass components with integral metal shield
casing and cutoff waveguide for beam exit, to reduce RFI
in nearby equipment by 40 to 50 dB; 2) Optimize the
power output of the laser using a high-pressure (6 Atm.)
spark gap instead of the original atmospheric-pressure
one, together with a more powerful 60 kV 120 W
adjustable power supply and end-tapered 30 MW
60 W charging resistor chain; 3) Verify power output
using a self-built microstripline PIN photo diode UV
detector with 1 ns sampling oscilloscope, and a
commercial radiometer (peak powers of 1.4 kW at 25 Hz
repetition rates were obtained); 4) Attempt to pump
quartz cell filled with 0.0001 M rhodamine 6G dye into
lasing.
|